Engagement rate is the first number a brand looks at, and it is the number creators most often quote wrong. Not dishonestly. There are three accepted ways to calculate it and they produce wildly different answers for the same account, so whichever one you picked probably flatters you a little.
Worth sorting out, because the version a brand's software calculates may not be the version on your media kit.
The three formulas
All three divide interactions by an audience number. The argument is entirely about what goes on the bottom.
- Engagement by followers. Interactions divided by your follower count. This is the default in most brand-side tools and the one people mean when they say "my engagement rate". It is also the least useful, because it assumes your followers are who saw the post.
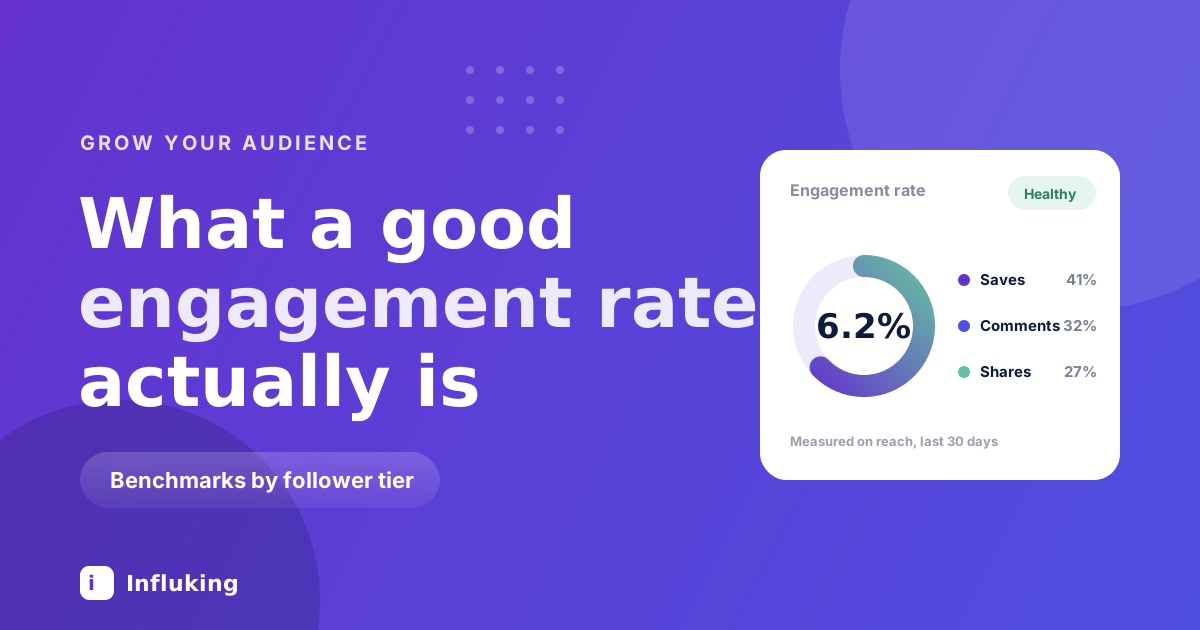
- Engagement by reach. Interactions divided by accounts reached. This answers the question that actually matters: of the people who saw it, how many did something? Instagram gives you both numbers in Insights.
- Engagement by views. Interactions divided by plays, used for Reels. Views run far ahead of reach because one account can watch twice, so this always produces the smallest number of the three.
Take a Reel that reaches 40,000 accounts, gets 60,000 plays and 2,400 interactions, on an account with 3,000 followers. By followers that is 80%. By reach it is 6%. By views it is 4%. Same post, three numbers, all technically correct.
Use reach when you are judging your own content, because it is the one that tells you whether the post worked. Expect brands to quote the follower version at you anyway.
Which interactions count
Older formulas counted likes and comments and stopped there. That made sense when the feed was chronological and sharing meant tagging someone in the comments. It does not describe how Instagram ranks anything now.
Saves and shares carry more weight than likes, both in the algorithm and in what they tell you. A like costs nothing. A save means someone intends to come back, and a share means they put your post into a private conversation and attached their own credibility to it. If your tool lets you include saves and shares, include them, and say so when you report the number.
The Instagram algorithm guide goes into which signals feed distribution and how much each one is worth.
What counts as a good engagement rate
These are rough bands for the follower-based formula, which is what you will be compared against. They shift by niche and they shift every year, so treat them as a sanity check rather than a target.
- Under 1,000 followers. 5% to 8% is normal. A small, mostly-known audience interacts heavily.
- 1,000 to 10,000. 3% to 6%. This is where most brand deals start and where the benchmark is watched most closely.
- 10,000 to 100,000. 2% to 4%.
- 100,000 to 1 million. 1.5% to 3%.
- Over 1 million. Often under 1.5%, and nobody minds.
Niche matters as much as size. Fitness, food and personal finance run hot because people have opinions and questions. Aggregator and meme accounts run cold because the content gets consumed and scrolled past. A 2% rate in a dry B2B niche can be worth more to a brand than 9% on a page that reposts other people's videos.
Why smaller accounts score higher
This is arithmetic rather than anything mystical. At 800 followers, a good chunk of them know you personally or found you deliberately, and Instagram shows your posts to most of them. At 80,000, the follower list includes everyone who ever tapped follow after one Reel two years ago and has not opened the app since. They still sit in the denominator.
So a falling rate as you grow is expected and is not a sign anything is broken. What matters is whether it is falling faster than the tier bands above suggest it should. The earnings breakdown by tier covers why this is also the reason micro creators often out-earn larger accounts per follower.
Why Reels broke the follower formula
The follower-based number was designed for a feed where your audience saw your posts. Reels go to strangers, so reach routinely runs at five or ten times your follower count, and the formula starts returning percentages above 100.
Two consequences. A Reels-heavy account can post a genuine hit and watch its follower-based rate spike into nonsense territory. And an account that grew fast on one viral Reel will show a terrible rate afterwards, because it collected thousands of followers who were never really interested in the topic.
If your rate dropped hard right after a growth spurt, that is usually what happened. It recovers as you keep posting and the new followers either engage or drift.
What actually raises it
Most advice here amounts to begging for comments. That works for a week and trains the algorithm to send you people who type one word and leave.
- Make things worth saving. Anything someone might need later earns saves: a checklist, a setting, a recipe, a script. Saves are the highest-value interaction you can design for on purpose.
- Give people something to send. Shares come from posts that say something a viewer wants to say to a specific person. That is usually a strong opinion, an inside joke about a shared situation, or a genuinely useful answer.
- Ask a real question. "Thoughts?" gets nothing. A question with a stake in it, where people disagree and have to explain themselves, fills a comment section. Ask about their situation, not your content.
- Reply properly in the first hour. Early interactions matter more, and a reply that is more than an emoji usually gets a reply back, which counts again.
- Fix the hook before anything else. A post nobody watches past second two cannot be engaged with. The hook formulas guide has the templates, and the caption guide covers the first line, which is doing the same job in text.
- Cut the posts that do nothing. Filler lowers your average and teaches Instagram your account is low-signal. Three good posts a week beat six where two are padding.
The uncomfortable lever is niche discipline. Off-topic posts get low engagement because the audience came for something else, and enough of them drags the account average down for months.
Each of these is covered properly in the guide to increasing your engagement rate, along with a 30-day plan and a way to test one change at a time.
What brands actually check
Assume any brand worth working with runs your handle through an audience-quality tool before replying. They are looking at the rate, and also at whether it holds up.
- Consistency across posts. A steady 4% reads as real. Two posts at 15% and eleven at 0.8% reads as bought or boosted.
- Comment quality. Tools flag comment sections that are mostly emoji, mostly the same handful of accounts, or mostly generic phrases. That pattern is what a pod looks like from the outside.
- Follower geography. An audience in countries the brand does not sell to is worth nothing to them, whatever the rate says.
- Growth shape. Smooth curves are fine. Vertical jumps of a few thousand in a day get flagged.
Put the reach-based number on your media kit with the window it covers, and say which interactions it includes. Specific numbers with their method attached survive scrutiny better than one impressive percentage with no context, and they justify the prices in your rate card.
The shortcuts that get caught
- Engagement pods. The same twenty accounts commenting on everything is the easiest pattern in the world to detect, and it corrupts your analytics so you can no longer tell which posts actually worked.
- Comment-bait giveaways. The rate spikes, then falls below where it started, because you added followers who wanted a prize.
- Buying likes or comments. Same problem as buying followers, with the added tell that the interactions arrive from accounts with no posts.
- Deleting weak posts. Tempting, and it only cleans the average on your profile. Brand-side tools pull historical data, and you have deleted the evidence of what was not working.
How to track it without losing the plot
Once a month, take your last fifteen or twenty posts, and for each one divide interactions by accounts reached. Sort the list. The top of it is your content plan and the bottom is your list of things to stop making.
Track the median rather than the average, because one viral post drags an average somewhere that does not describe your normal week. And compare against your own numbers from three months ago rather than against a creator in a different niche with a different audience size.
Checking daily tells you nothing. Engagement on a single post keeps moving for a week now, since Reels get resurfaced long after they are posted.
A good engagement rate is mostly evidence that you are making things for a specific group of people who wanted them. That is also the thing brands are buying, which is why the number carries so much weight in a pitch. If you want the deals to come to you rather than the other way round, Influking matches creators with brands running campaigns in their category, and the engagement figures come straight from your connected account rather than a screenshot.