Instagram Insights presents dozens of metrics with no indication of which ones should change your behaviour. Most creators respond by checking everything daily and acting on none of it.
A dashboard is not more data. It is fewer numbers, tracked over time, in one place you actually look at. Four or five is enough to run on.
Leading and lagging
Follower count and total revenue are lagging indicators. They tell you what already happened and cannot be acted on directly.
Follows per Reel, non-follower reach share and saves per post are leading indicators. They move first, they respond to what you change, and they predict where the lagging numbers go next.
Track both, but make decisions from the leading ones. Watching follower count daily is the most common way creators feel busy while learning nothing.
The numbers worth tracking
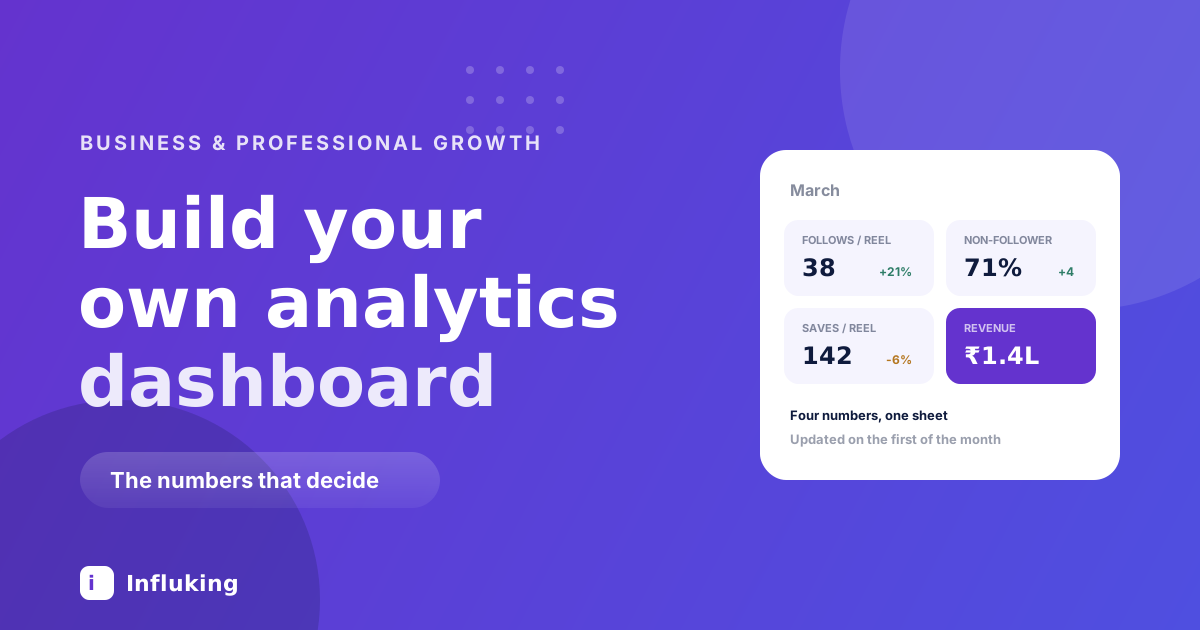
- Follows per Reel. The best single growth metric. Total new follows divided by Reels published. Rank your posts by it and you have a content plan.
- Non-follower reach share. What percentage of reach came from people who do not follow you. Below about half means your content is circulating internally and growth will be slow.
- Saves and shares per post. Stronger distribution signals than likes and a better measure of whether the content was worth keeping.
- Engagement rate on reach. Measured on accounts reached rather than followers, per the engagement rate guide.
- Profile visits to follows. Your profile conversion rate. A wide gap means the grid and bio are the problem rather than the content.
- Revenue, and revenue per post. The number that makes this a business rather than a hobby, and the one most creators never write down.
Four of these is plenty. Six is the maximum before it becomes an admin task you skip.
Building the sheet
One tab, one row per month, one column per metric. That is the whole structure.
- Columns: month, posts published, total reach, non-follower share, new follows, follows per post, saves per post, engagement on reach, revenue, revenue per post.
- On the first of each month, pull last month's figures from Insights and fill one row.
- Add a second tab listing individual posts with date, format, topic, reach, follows and saves.
- Sort that second tab by follows to see your best performers at any time.
Twenty minutes to build, ten minutes a month to maintain. The per-post tab is where the actual insight lives, because the monthly row tells you whether things are improving and the post tab tells you why.
Where the numbers come from
Most are in Insights under professional dashboard, with reach, follows and interactions broken down by post. The ones people miss are non-follower reach, which appears per post under accounts reached, and profile visits, which sit in the overall account view.
Note the date range Insights defaults to and keep it consistent, since comparing a 30-day window against a 7-day one produces nonsense. Pulling on the first of the month for the previous calendar month keeps this clean.
Revenue comes from your own records rather than from Instagram, which is another reason to keep the deal tracking in the creator CRM current.
Track medians, not averages
One viral post distorts an average badly enough to make a bad month look good. A creator whose Reels normally get 3,000 views and who had one hit 200,000 has an average that describes nothing.
The median tells you what a typical post does, which is what you are actually trying to improve. Track the outlier separately, because understanding why it worked is valuable, but do not let it hide the baseline.
What the numbers tell you
- High reach, low follows. Profile problem. The content works and the profile does not convert, which the profile checklist fixes.
- Low non-follower share. Distribution problem. Content is circulating among people who already know you.
- Good reach, low saves. Entertaining but not useful. Fine, unless you sell something.
- Follows falling while reach holds. Usually topic drift. The right people are not the ones seeing it.
- Everything flat for months. The format has plateaued. Change something deliberately rather than posting more of the same.
- Revenue flat while reach grows. A selling problem, not a content problem, which is what building a creator business addresses.
Monthly, not daily
Reels accumulate reach for days and sometimes weeks, so a post judged after an afternoon tells you nothing. Daily checking also produces emotional decisions, which is how people abandon a format two weeks before it would have worked.
Pull the numbers once a month, look at them properly in one sitting, and leave them alone in between. The reviewing ritual is covered in the monthly review, and the dashboard is what feeds it.
Mistakes
- Tracking everything. Twelve metrics means no decisions.
- Only tracking vanity numbers. Followers and likes are the least actionable things available.
- No revenue column. The whole point of the exercise for most people.
- Comparing against other creators. Different niche, different size, different content. Compare against your own last quarter.
- Building it and never opening it. A dashboard nobody reads is a spreadsheet.
- Changing five things between measurements. Then the numbers cannot tell you which change did it.
The purpose is a short answer to one question every month: what should I make more of, and what should I stop. Any metric that does not help answer that can come off the sheet.